I kept redrawing the same three diagrams, so I built a tool
Here is the short version: I built CRAYON-C4, a free interactive tool that describes a software system three ways — how it is structured, how functionality flows through it, and where it runs — all from one shared model. I built it because I kept redrawing the same boxes and lines for every new team member, every design session, and every slide deck. It is live now, and I am looking for early users. The full story, and the tool itself, are below.
The same three pictures, every time
Every project I have worked on needed the same explanations, over and over:
- A new developer joins: "How does this system fit together?"
- A functional discussion starts: "What actually happens when the user clicks this?"
- An ops or infra conversation comes up: "What runs where, and how do test and production differ?"
Three questions, three pictures. And in practice I drew each of them many times: once on a whiteboard, once for the wiki, once for a slide deck, once more when the whiteboard photo turned out unreadable. Each copy was slightly different. Each copy started aging the moment I drew it.
What I tried first
I tried the tools you would expect, and I want to be clear: every one of them is good at what it set out to do. I still hit one of three walls each time:
- Capabilities. I could draw the structure, but not connect it to how the functionality flows through that structure, or to where things are deployed. Three questions meant three disconnected files.
- Constraints. Some tools have a firm opinion about what a model may contain. That rigor is a feature — but when my system didn't fit the shape, I ended up modelling the tool instead of the system.
- Appearance. Some results I simply didn't want to put on a big screen in front of stakeholders, so I would redraw the diagram in a presentation tool. Now there were two copies again.
None of that is criticism. Those tools made trade-offs; mine turned out to be different ones.
What I actually wanted
Writing it down made it obvious that I wanted one thing, not three:
- One model, several views. The "Order API" box in the architecture view, the lane in the flow view, and the deployed instance in the infrastructure view should be the same element. Rename it once, every diagram follows.
- Zoom like a map. Start at the system landscape, drill into a system, drill into a container — the way the C4 model describes it.
- Behavior bound to structure. Swimlanes where the lane is the container, so "who does this step" is a link, not a guess.
- Deployment bound to structure. The same containers, placed on real infrastructure, per environment.
- Presentable as-is. Good enough on a big screen that I never redraw a diagram in a slide tool again.
I looked for that combination for a while. Then I built it.
What it became
CRAYON-C4 runs in the browser. The short tour:
- C4 structure diagrams with drill-down: context → container → component → code, each level a view derived from the same model.
- F4 behavior diagrams: swimlane flows per process, where lanes bind to C4 elements and can collapse to a higher C4 level when you want the summary instead of the detail.
- Deployment views: environments, infrastructure nodes, and instances of the same containers your architecture names — with a warning when a deployment connection has no architectural counterpart.
- Diagrams from code: a CLI (
npx crayon-c4 .) and a VS Code extension that extract the structural skeleton from a repository, and a merge that never silently discards what you curated by hand. - Local-first: it works without an account. Projects live on your device; cloud save is optional; JSON export is free on every tier.
Three questions, three pictures — from the actual app, on the same demo project:
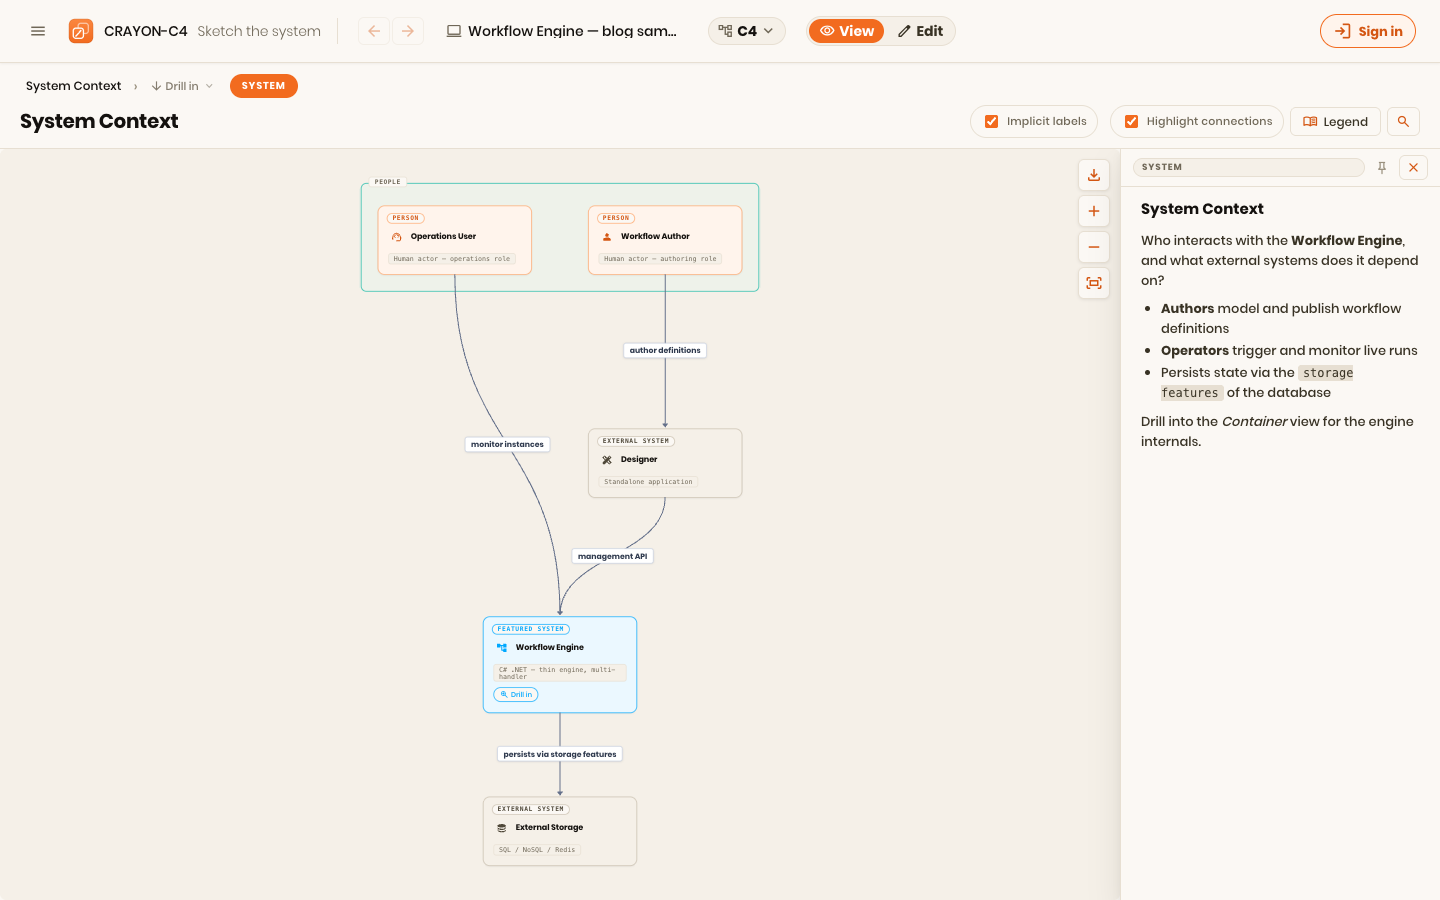
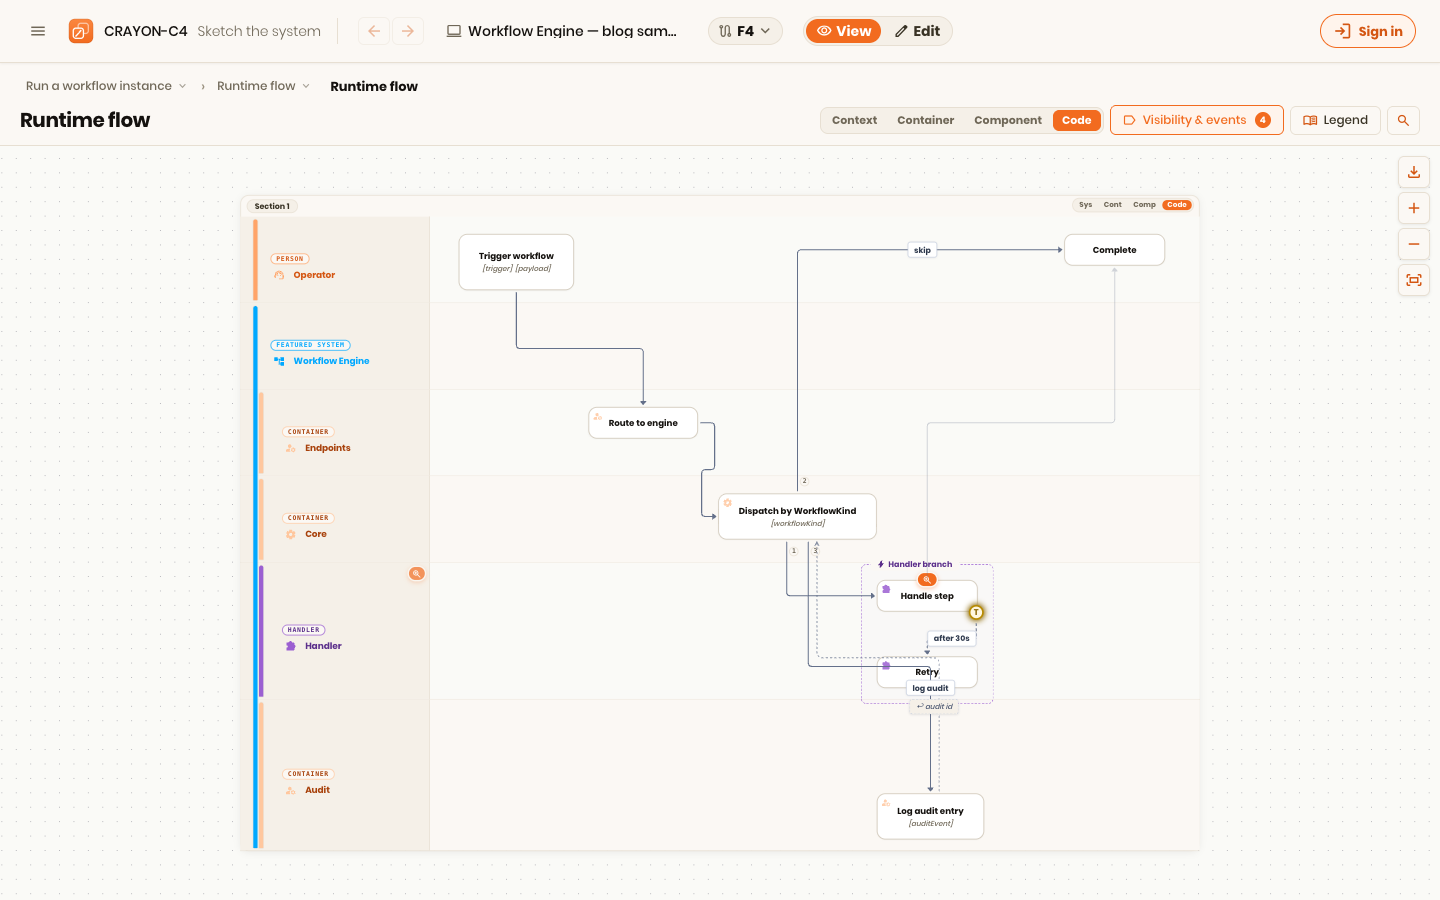
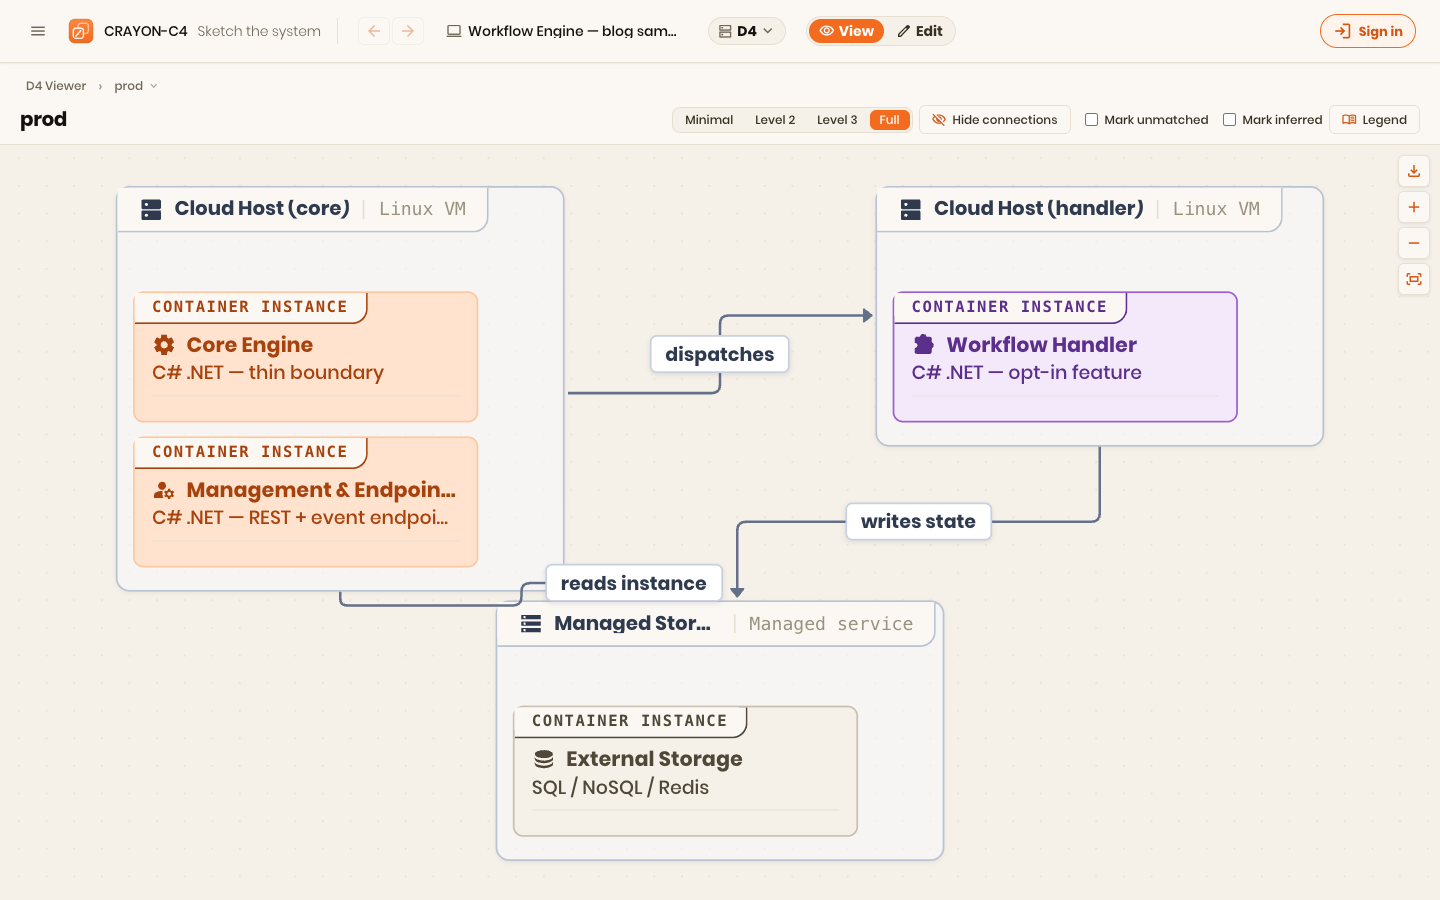
This is the point where telling stops working and showing starts. Below is the demo project — a workflow engine — in the same viewer the app uses. It is live: drag things, click things, drill down into the engine.
What I need now
The tool is at the stage where it needs users more than it needs features. If you try it, three things help me enormously:
- Break it. Import your own model, generate one from a repository, push the editor around. Tell me where it fails.
- Tell me what's missing. What would stop you from using this with your team next Monday?
- Tell me where it's unclear. If a concept needed explaining, the tool failed to explain it.
You can reach me through the support page, or just reply wherever you found this post.
The next posts in this series step back from the tool: what the C4 model actually is, why structure diagrams can't answer behavior questions, what a deployment view is for, and how to keep all of it true as the code changes. The diagrams in those posts will be live too.