The C4 model, explained with one online store
The C4 model is a way to describe a software system at four levels of zoom — Context, Containers, Components, Code — so that each audience gets one diagram that answers their question, instead of one diagram that tries to answer everything and answers nothing. That is the whole idea. The rest of this post walks it through on a small online store, and the diagrams are live: you can pan, drill down, and click every element.
The C4 model, created by Simon Brown, describes a software system as a hierarchy: software systems are made of containers (things that run), containers are made of components (things that are built), components are made of code. Each level gets its own diagram type. See c4model.com.
Why levels at all?
The classic failure mode of architecture documentation is the One Big Diagram: forty boxes, three notations, arrows in every direction. It exists because it was drawn for everyone at once — the new developer, the ops engineer, the product manager, the auditor.
Maps solved this problem long ago. A country map does not show street names, and a street map does not show country borders. Nobody calls that "hiding information"; it is choosing a zoom level per question. C4 applies the same rule to software:
| Level | Diagram | Question it answers |
|---|---|---|
| 1 | System Context | Who uses the system, and what does it depend on? |
| 2 | Container | What are the deployable/runnable pieces inside? |
| 3 | Component | What are the building blocks inside one container? |
| 4 | Code | How is one component implemented? |
Level 1 — System Context
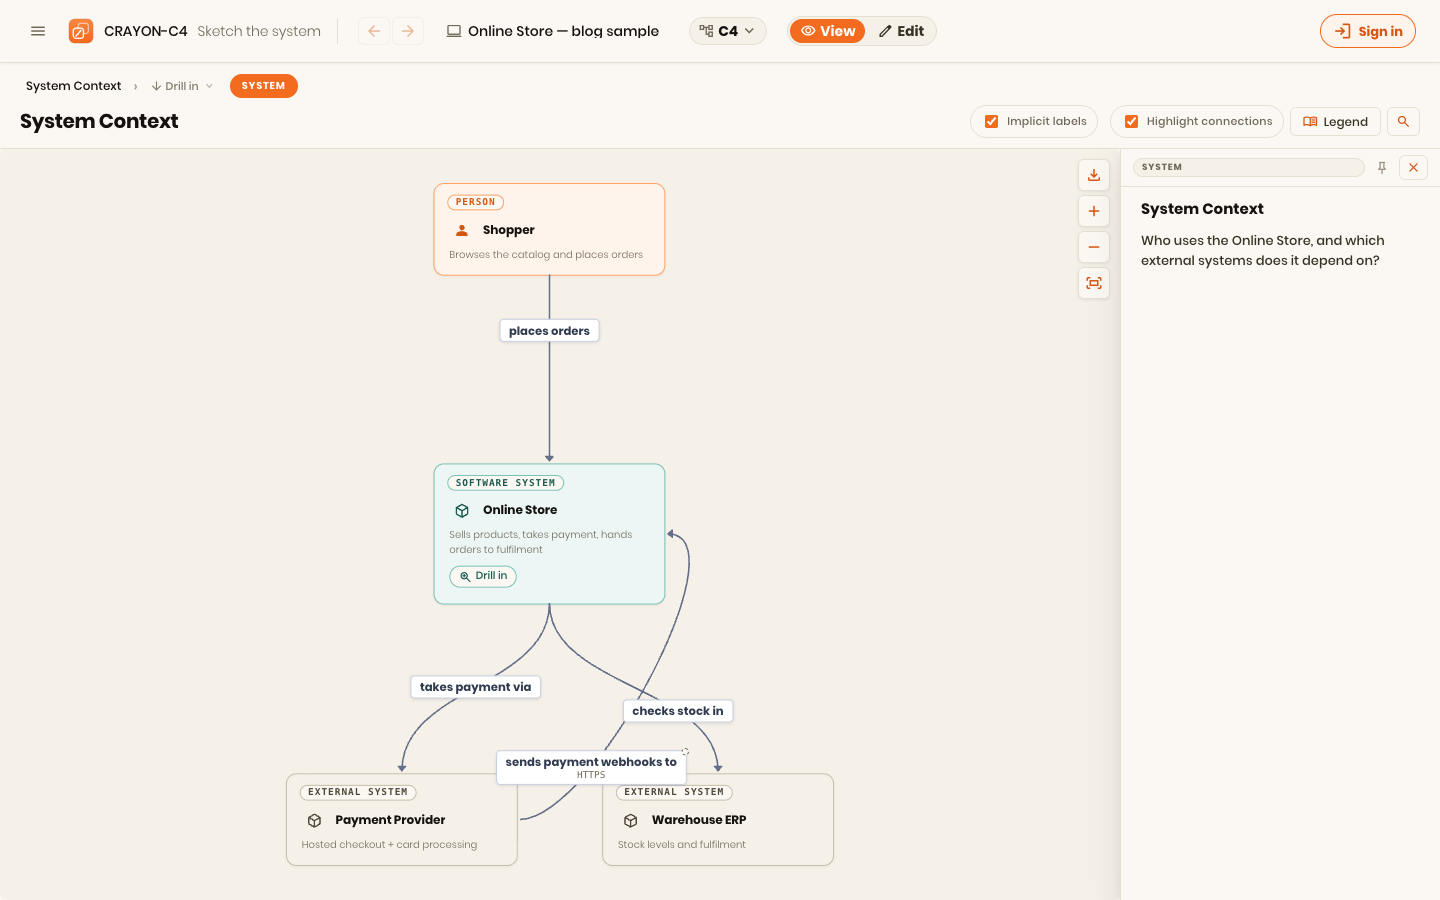
Our example is an online store. At level 1, the store is a single box. The diagram shows:
- Shopper — the person placing orders.
- Online Store — the system we are describing. One box, no internals.
- Payment Provider — an external system that processes cards.
- Warehouse ERP — an external system that knows stock levels.
That is the entire diagram, and that is the point. It answers: who uses this, and what does it depend on? A stakeholder can read it in ten seconds. Everything you leave out here — frameworks, databases, queues — has its own level further down.
Two habits make context diagrams work:
- Name systems by what they are for, not what they run on. "Online Store", not "shop-frontend-v2 cluster".
- Keep external systems visible. Half the risk in any system lives at its boundary.
Level 2 — Container
Now we zoom into the Online Store box. In C4, a container is anything that runs or is deployed separately — an application, a database, not a Docker container specifically (the name predates the hype).
Inside the store's boundary we find three containers:
- Storefront Web App (React) — catalog, cart, checkout UI.
- Shop API (Node.js) — orders, payments, stock checks.
- Order Database (PostgreSQL) — orders, customers, payment state.
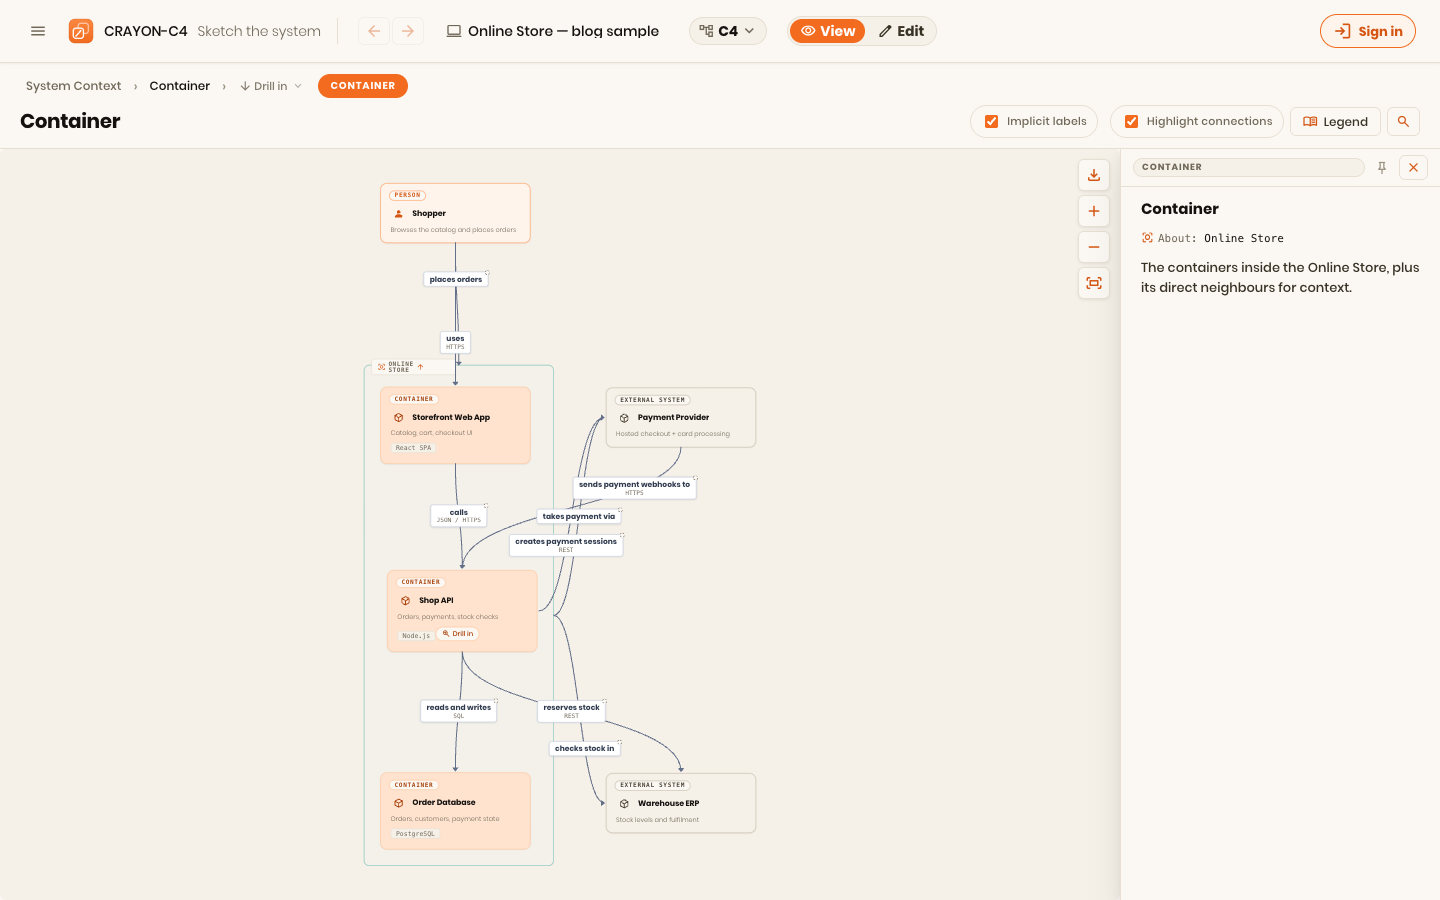
The neighbours from level 1 — shopper, payment provider, ERP — stay on the diagram, because a container view without its outside world loses orientation. The arrows get more specific: the shopper uses the web app over HTTPS, the web app calls the API, the API reads and writes the database and talks to the two external systems.
Here are all four levels, live. Start at the context view, drill into the Online Store, then into the Shop API, then into the Payment Component:
Levels 3 and 4 — when you need them
Component diagrams (level 3) open up a single container. In the embed above, the Shop API shows exactly that: an order component, a payment component and a stock component, and how they collaborate. Draw one when a container genuinely needs explaining — not for every container, out of completeness. Completeness is how diagrams die.
Code diagrams (level 4) are almost never drawn by hand — if you need one, generate it from the code; it changes too often for anything else. The Payment Component's code view above shows the shape: a session builder, a provider client, and the webhook path back into the order.
Rules of thumb
If you take four things from this post:
- One diagram, one question. If you cannot say which question a diagram answers, it will answer none.
- Boxes are nouns, arrows are verbs. "Shop API — reserves stock in → Warehouse ERP" reads as a sentence. Sentences are checkable.
- Label the technology where it matters (protocols on arrows, stacks on containers), and nowhere else.
- Stop drawing when the questions stop. Most systems need a context diagram and a handful of container diagrams. Deeper is optional.
The diagrams in this post are drawn in CRAYON-C4, the tool I build — the embed above is the actual viewer, and "Open in the designer" gives you the model to take apart. But everything above holds regardless of what you draw with.
Next in this series: four diagrams, four questions — how to draw each C4 diagram to the one thing it is for, and what to leave out of each.