Four diagrams, four questions — draw each to its intent
The previous post introduced the C4 model as four levels of zoom. This one is about the craft: each of those four diagrams exists to answer exactly one question, and each has a category of detail it must refuse. Draw one without that discipline and it quietly stops being useful — it becomes a picture that is technically correct and practically ignored. So here is each of the four, by intent: what it is for, what belongs on it, and the one thing that ruins it.
The four C4 diagrams are abstractions, not deployment or code listings. A system is made of containers, a container of components, a component of code — and each level gets a diagram whose job is to answer one audience's question and leave the rest to the level below. See c4model.com.
Context — one system, and the world around it
The system context diagram answers four questions and no more: what is the system we are building, who uses it, what are those people trying to do with it, and how does it fit the landscape that already exists?
Its scope is a single software system. That is the discipline — you may draw more than one box, but the diagram is about one of them, with the people and other systems that touch it arranged around it. The content is only two kinds of element — people and software systems — and the relationships between them. An external system is still a software system; it just lives outside your boundary. The focus stays on actors, roles, and personas on one side and systems on the other. Technologies, protocols, and data formats belong nowhere near this diagram.
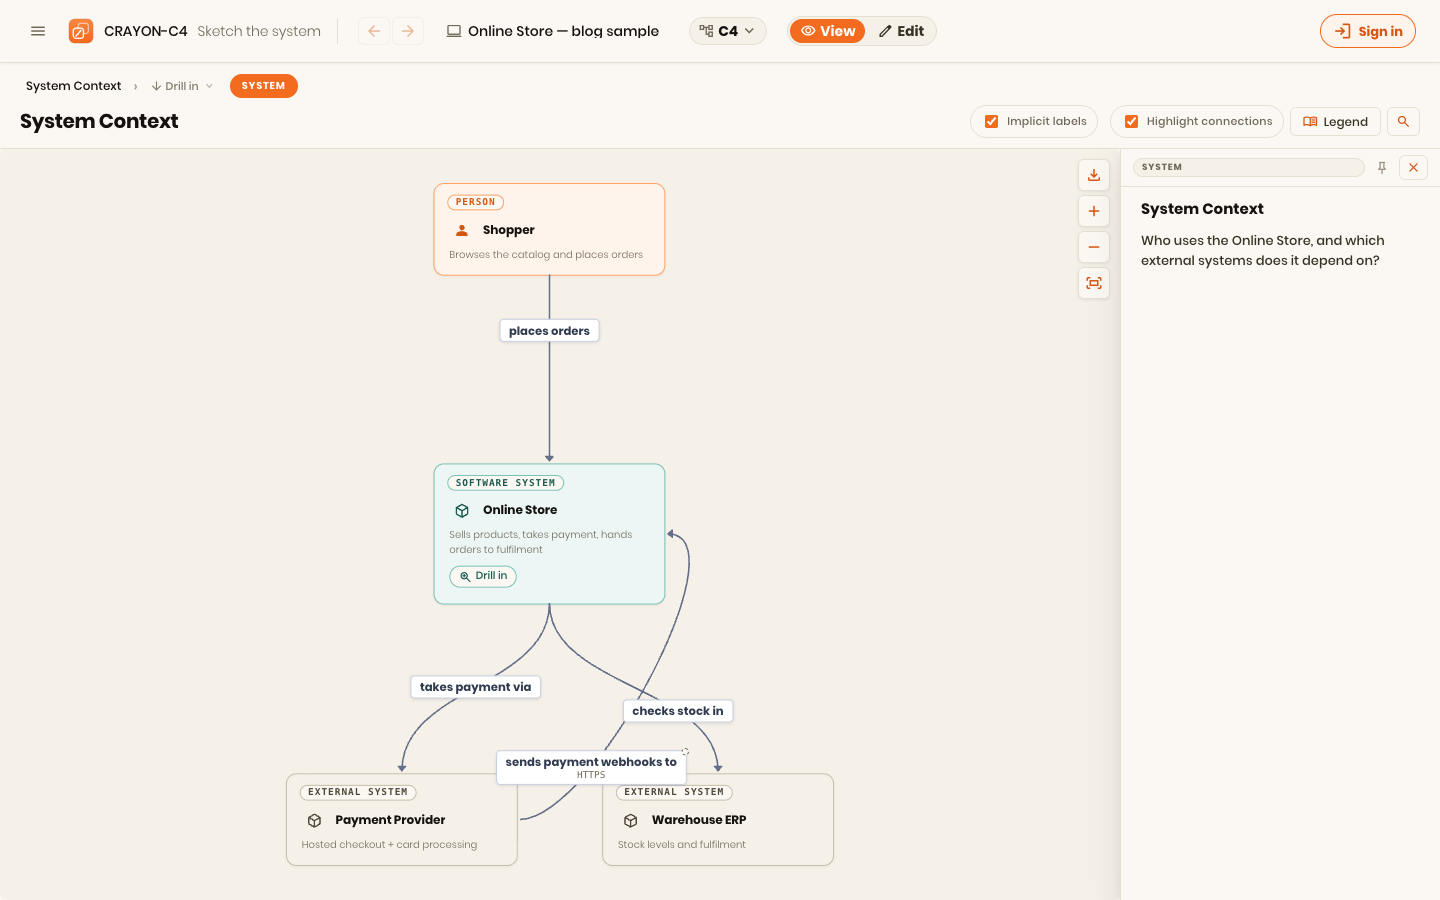
Two habits make it work. First, name people by their role, not the person, and don't put the function in the box — "Customer", "Catalogue manager", not "Dave from sales" and not "the customer placing an order". The function rides on the connection instead: the arrow out of a role carries the verb — what that role activates in the system — so "Customer → places orders through → Online Store" reads as the intent, role and relationship together. Second, name systems for what they are for, and describe each in a line. Relationships stay unidirectional arrows summarised at a high level — "places orders through", not "POSTs JSON over HTTPS to".
This diagram earns its place by making scope explicit so nobody has to assume it: it shows what is being added to an existing landscape, gives technical and non-technical people a single picture to start a conversation or an onboarding from, and tells you who you will need to talk to when you go hunting for interface details. It draws the system boundary — what is inside the thing you are building and what sits outside it. And there is no rule that you get only one; a large landscape can have several context diagrams, each centred on a different system or a different thing you are trying to explain.
Container — the pieces that run
Zoom into that single box and you get the container diagram. It answers: how is the system composed into applications and data stores, what is each one responsible for, what technology does it use, how do they communicate, and — as an engineer — where do I go to add a feature?
A container is an application or a data store: a thing that runs or a thing that holds state. Each carries a name, a technology (the implementation choice — Node.js, PostgreSQL — not where it is deployed), and a one-line reason for existing. The people and external systems from the context view stay on the diagram, because a container view with no outside world loses its bearings — and because showing where external systems touch your containers is exactly what a threat or vulnerability discussion needs. The system's boundary is drawn as a box around the containers; in CRAYON-C4 that boundary box is the default, because it keeps the diagram anchored to the context view above it. Relationships use the same arrows as before; what changes is the annotation — a summary of the relationship ("makes API requests to") and a subtitle for the primary protocol ("JSON/HTTPS", "SOAP"). Keep those arrows to genuine inter-container communication — the interprocess calls that usually cross a network.
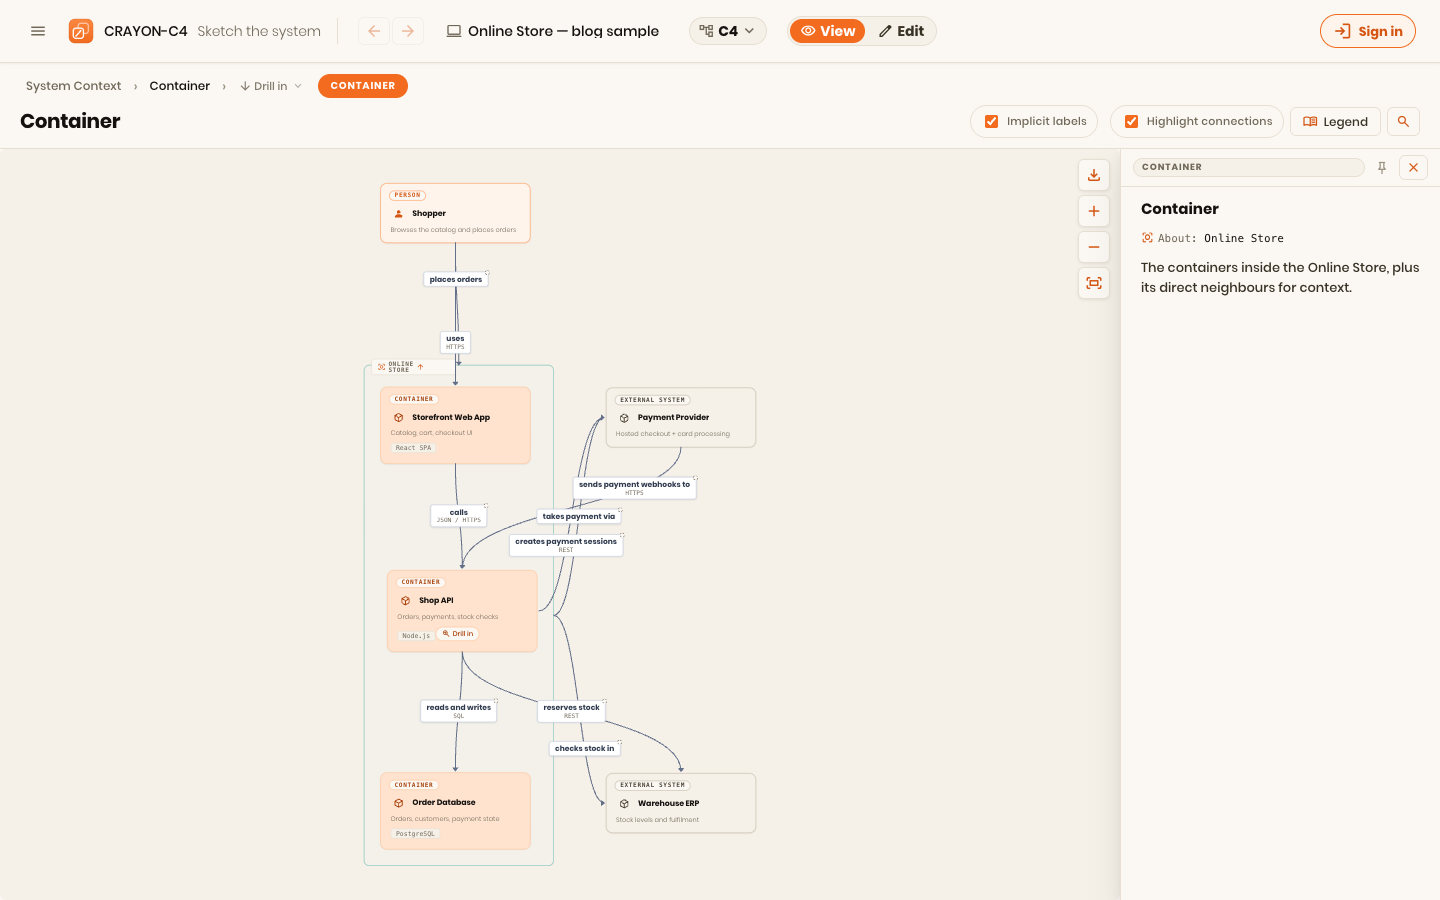
The container diagram is the one to draw during an up-front design exercise: it shows what actually has to be built, deployed, and operated, makes the primary technology choices explicit, and lets you review a design before it exists — can this container reach that database; does wiring it this way expose something it shouldn't? It is also the diagram that bridges the quiet gap between developers, who often don't see how the system runs in production, and operators, who often don't see how it decomposes into applications and data stores.
Here is the trap. A container diagram should say almost nothing about deployment — no clusters, load balancers, firewalls, or API gateways — because those differ from one environment to the next, and test is not production. The C4 abstraction diagrams describe interactions: who talks to whom, why, and what is communicated. Where it runs is a separate question with its own diagram (part 5). And "container" here has nothing to do with Docker or Kubernetes; the word predates the hype and just means a runnable or storable piece.
Component — inside one container, when you need it
The component diagram opens a single container: how is it composed into components, what is each responsible for, how do they collaborate, and what frameworks make them work? A component is a grouping of related responsibility behind an interface — the major seams of the application, not individual classes. Each has a name, a technology, and a short description; the container's boundary is the box. It is a technical diagram for the engineering team and anyone curious about how the code is structured, and it is useful when it shows the high-level shape of a container, the dependencies between its parts, and the libraries in play.
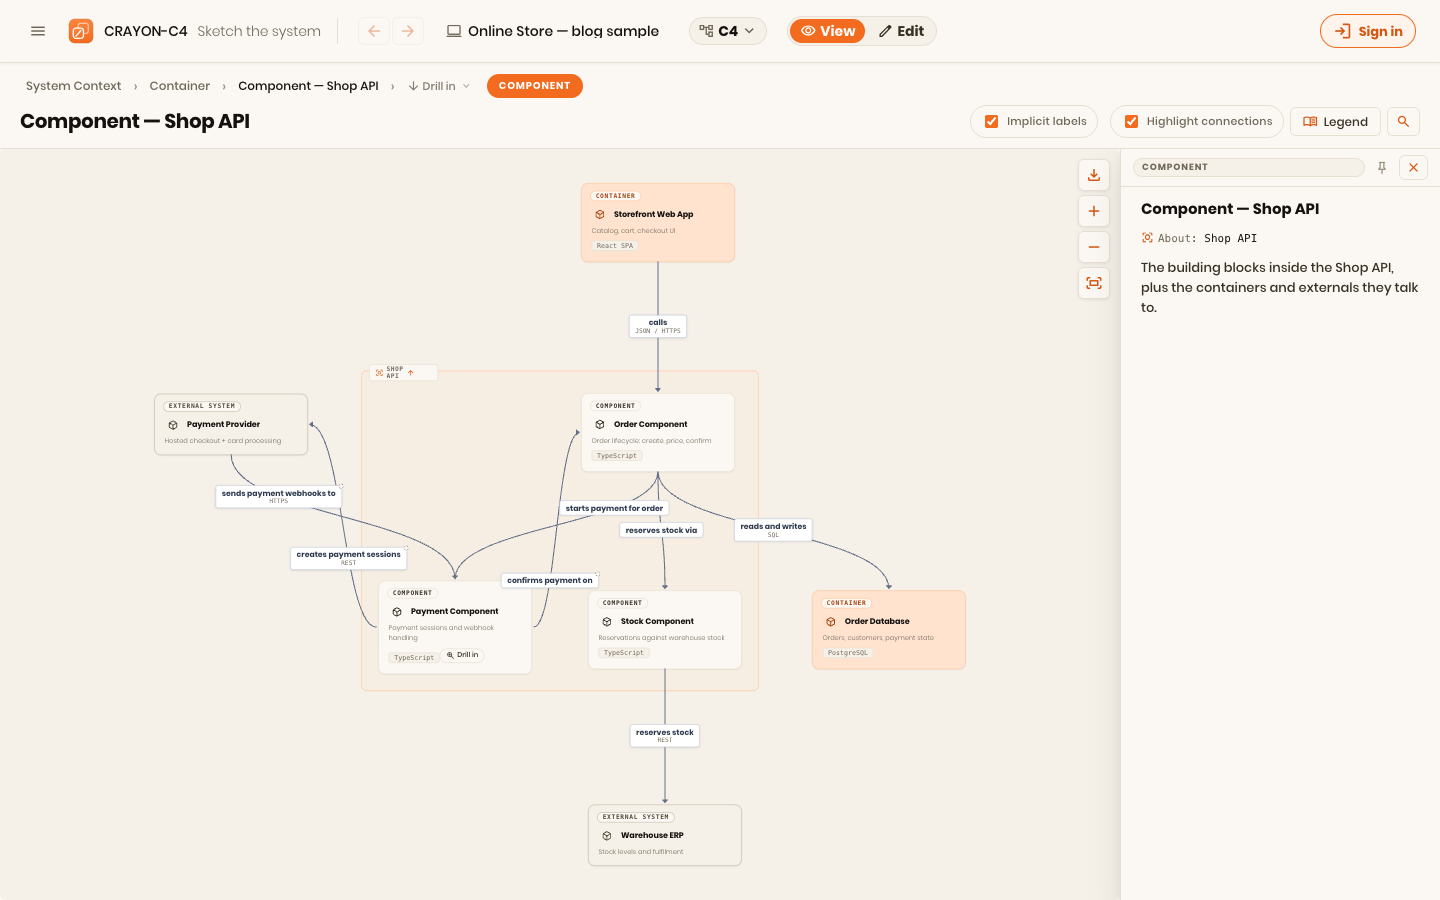
Most of the time you should not draw it. Reach for it only when the context and container diagrams left a real question open, or when one container is genuinely intricate enough to deserve explaining. For a simple container, reading the code tells the story better than a diagram ever will — and drawing diagrams no one needs is how a model dies of completeness.
Code — the level you almost never draw
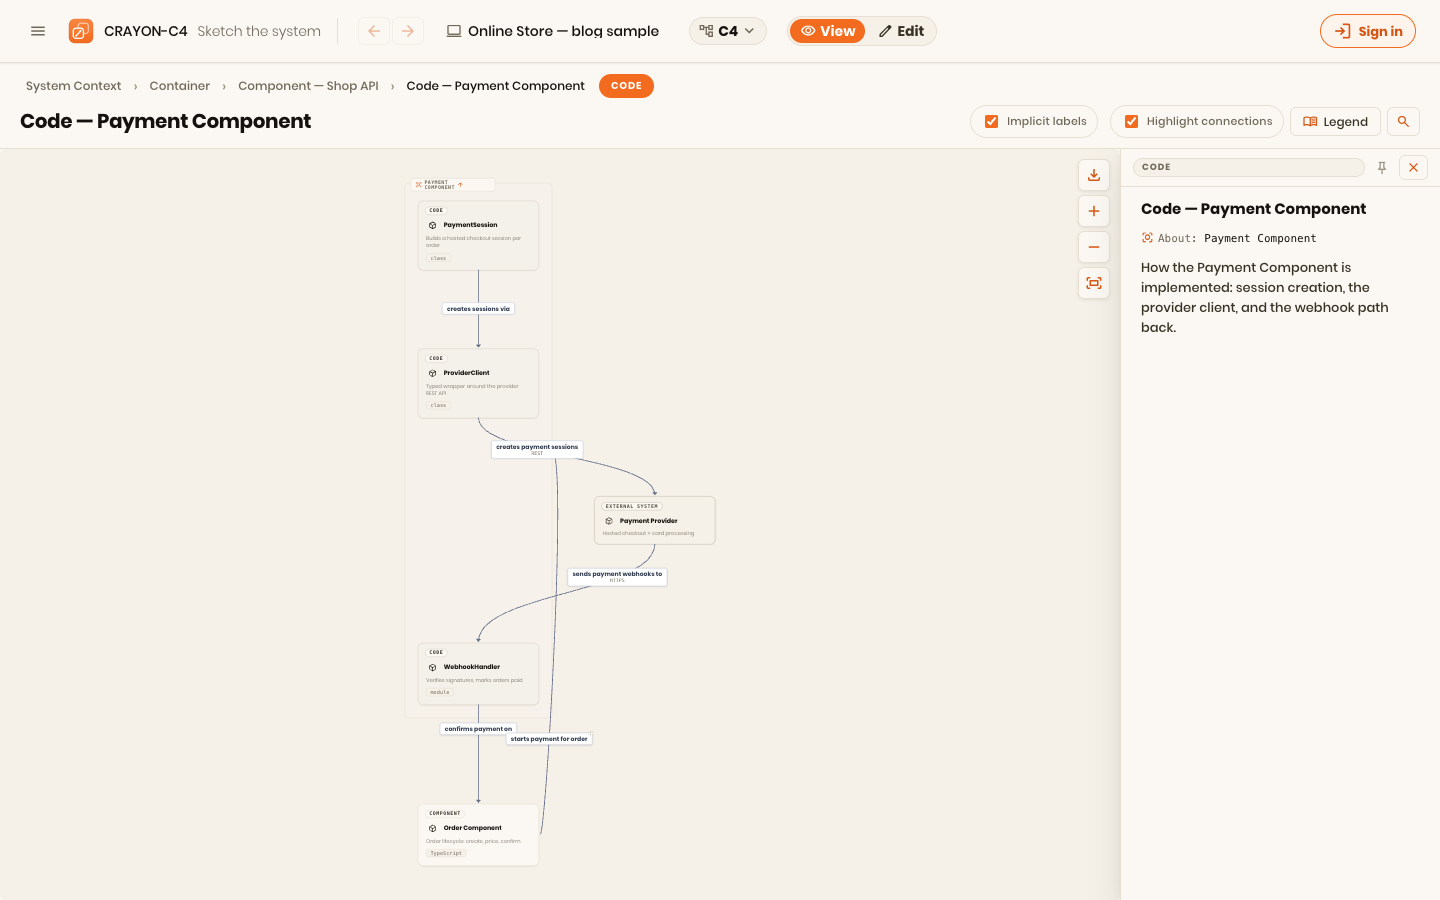
Below components sits the code diagram: classes, interfaces, methods — UML territory, the lowest level in the notation. Generate it from the code if you need it, because it changes far too often to maintain by hand, and draw it only when a single component is genuinely hard to follow. CRAYON-C4 supports it for exactly those moments, and treats it as opt-in for the same reason.
One anti-pattern, drawn twice
There is a single mistake that shows up at both ends of this hierarchy, and it is worth naming. In the book, even Simon Brown slips: the context example ties the system to AWS and Amazon SES — a deployment-and-technology-of-the-moment decision, placed on the most abstract diagram there is. It reads fine until the day you move off SES, or off that cloud entirely; now the abstract diagram is wrong, and so is everything below it. It is the same error as drawing a load balancer on a container diagram. The abstraction diagrams answer who, what, and why; the moment one of them answers where it runs, it has borrowed a liability from a diagram that changes on a completely different clock.
Keep deployment in the deployment view. Keep the technology-of-the-moment out of the boxes that are meant to outlive it. This is the entire reason a model keeps one set of elements and projects several views from them: so a rename or a re-platform is one edit, not five diagrams to chase down.
Rules of thumb
- Name the question first. If you cannot say which of the four questions a diagram answers, it answers none of them.
- People are roles; arrows are functions. Name an actor by its role and let the connection carry the verb — the function that role activates. Role plus relationship reads as the intent.
- Keep the boundary box. The system boundary from the context view is what makes a container diagram legible; CRAYON-C4 draws it by default.
- Detail belongs to a level. Protocols on container arrows, classes on code diagrams, infrastructure on the deployment view — and nowhere else.
- Stop when the questions stop. Most systems need a context diagram and a handful of container diagrams. Component and code are on demand, not by default.
Watch it happen
▶︎ Video placeholder — drop the screen recording here.
Building a full context → container → component → code set from a single model in CRAYON-C4: each diagram appearing at its own level, drawn to its own question — then a rename in one view rippling through all the others, so the model stays one thing instead of four copies.
The diagrams in this series are drawn in CRAYON-C4, the tool I build. The four abstraction diagrams above are one model projected four ways — the boundary box is the default, and deployment detail is deliberately kept out of the container view, for the reason this post is mostly about.
Next in this series: structure tells you what exists — it cannot tell you what happens. Behavior gets a view of its own.