The deployment story your architecture diagram isn't telling
Every container in your architecture diagram runs somewhere: a VM, a cluster, a managed service, a region. In most teams that knowledge lives in heads, deploy scripts, and a wiki page from two platform migrations ago. A deployment view writes it down — and it works best when it reuses the exact containers your architecture diagram already names, instead of introducing a second set of boxes that can drift away from the first. That is the whole argument; the rest is how.
In the C4 model, a deployment diagram shows how containers (the level-2 elements) are mapped onto infrastructure — deployment nodes such as servers, clusters, and cloud services, usually per environment. See c4model.com.
Three situations that expose the gap
The incident. Production is failing. The architecture diagram says the API talks to the database — but which instance, in which region, through which proxy? The person who knows is on holiday. Structure diagrams answer what talks to what; incidents need what runs where.
The environment question. "Is test actually like production?" Almost never — test shares a database node, production splits it; test skips the queue, production doesn't. Those differences are architecture, they explain a whole class of "works in test" bugs, and in most teams they are documented nowhere.
The new ops colleague. Onboarding a developer has a diagram. Onboarding the person responsible for running the system usually gets a bookmarks folder and a shrug.
What a deployment view contains
Not much — that is what makes it maintainable:
- Environments. Production, staging, test — each with its own instance of the picture, because the differences are the content.
- Deployment nodes. The infrastructure: clusters, VMs, managed databases, third-party services. Nested where reality nests (a pod in a cluster in a region).
- Container instances. The same "Shop API", "Order Database" boxes from the architecture view, placed on nodes. Two instances behind a load balancer? Draw two.
- Connections with protocols. The arrows now carry ports, protocols, directions — the level of detail the container diagram deliberately left out.
The key property is that item 3 reuses the architecture's containers. The deployment view should never invent its own vocabulary.
One model keeps both honest
When deployment placements are bound to the same model as the architecture:
- Rename or split a container and every environment's picture follows — no second set of boxes to update.
- You can ask coverage questions in both directions. Architecture says the API talks to the ERP — does any environment actually wire that connection? And the reverse, which is spicier: the deployment view has a connection between two instances that no architecture relationship explains. One of the two diagrams is lying, and now you know where to look.
That reverse check deserves a name: an unjustified deployment connection. In CRAYON-C4's deployment editor it surfaces as a warning overlay — every connection whose endpoints map to C4 elements but which no architecture relationship covers gets flagged. It stays legal to keep (real systems have exceptions); it just refuses to be invisible.
Here is that comparison from the demo project — the same three containers, placed differently per environment:
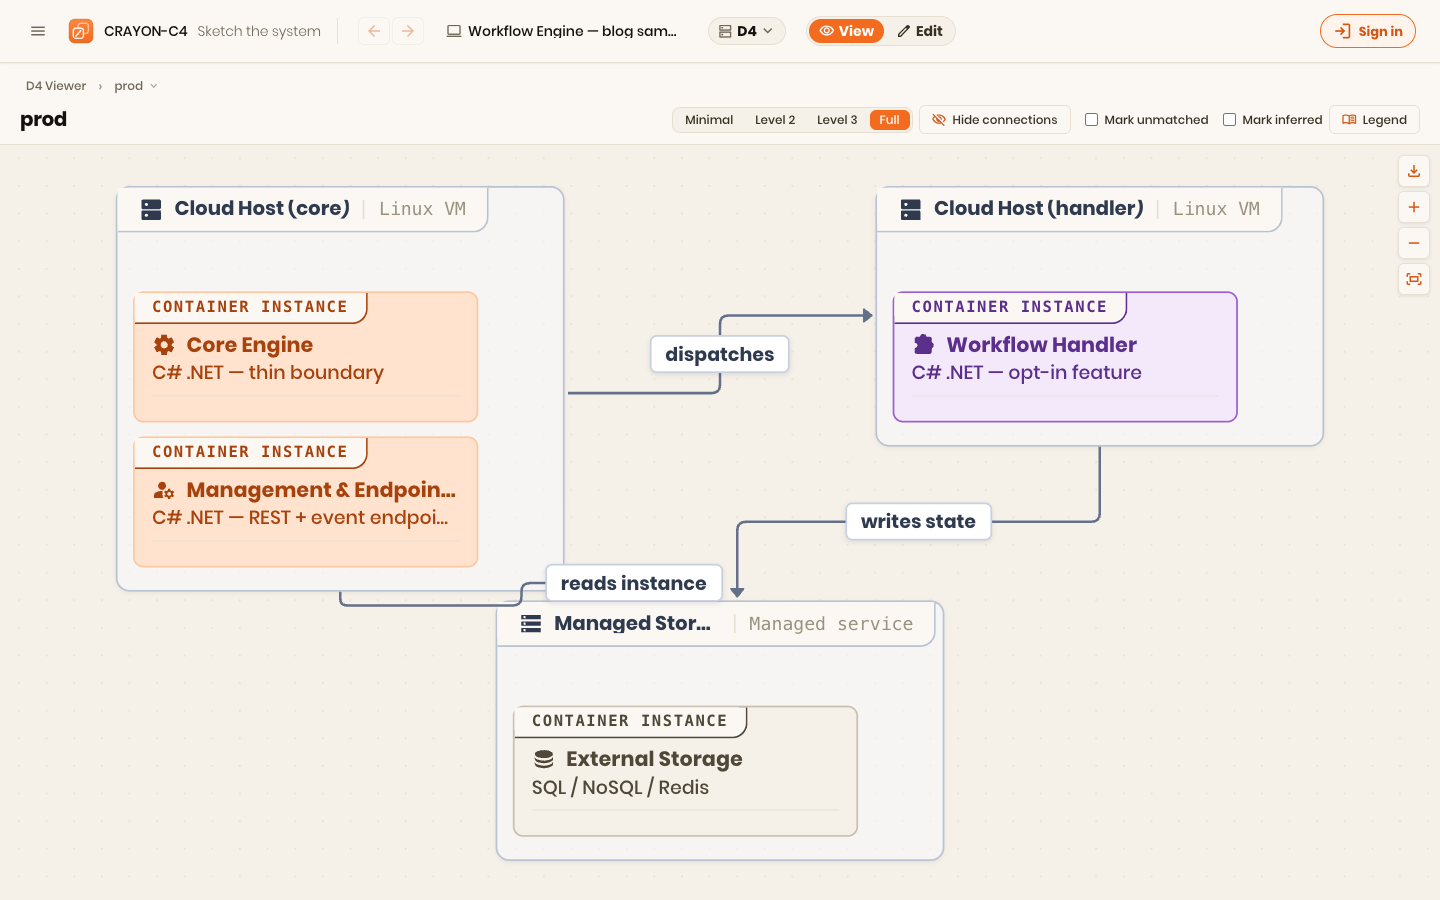
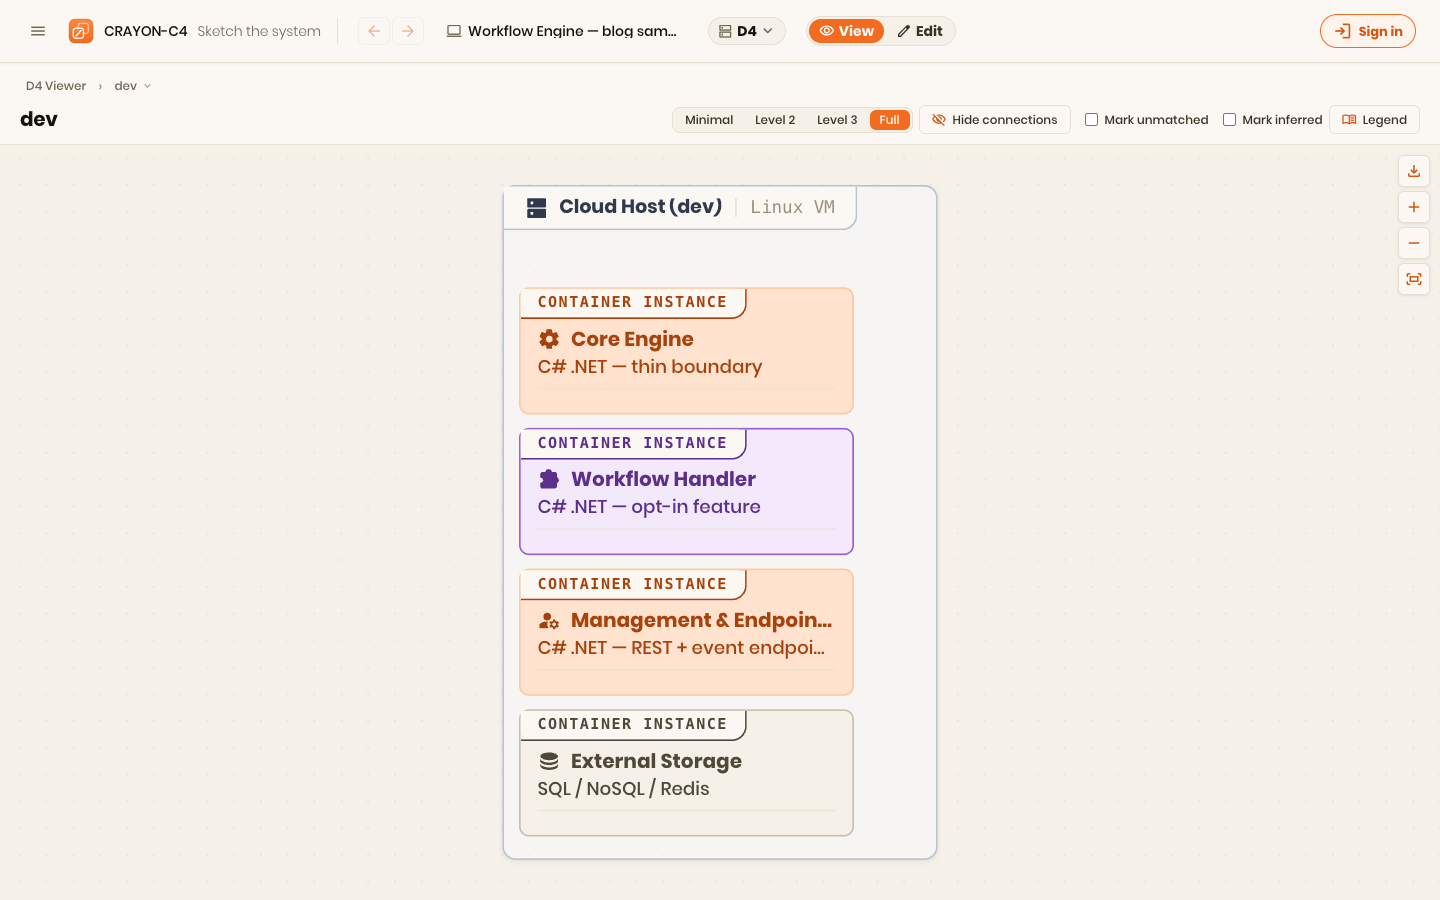
The demo project ships with a deployment view of the workflow engine — environments, the engine's containers placed on infrastructure, and the database placements. Open it and compare test against production:
Rules of thumb
- Per environment, always. A single "the deployment" diagram is a sign the differences are hiding.
- Reuse the architecture's containers. New boxes belong in the architecture first.
- Protocols on arrows. This is the diagram where ports and directions earn their place.
- Record the differences, not just the shapes. "Test shares one DB node" is the sentence that saves the next debugging day.
Next in this series: all three views — structure, behavior, deployment — share one enemy: time. Diagrams age. The last honest source is the code, so that's where we'll get the diagrams from.