Structure diagrams don't answer "what happens when…"
A structure diagram tells you what exists; it cannot tell you what happens. For that you need a behavior view. And the biggest win available in behavior diagrams today is not a new notation — it is binding the behavior view to the architecture view, so that "who performs this step" is a link into the model instead of a label someone typed. This post is about that gap and how to close it.
The question every architecture diagram fails
Put a container diagram in front of a new developer and the first question is always some form of:
"OK — so when the user clicks Pay, what actually happens?"
The diagram cannot answer it. It shows that the web app talks to the API and the API talks to the payment provider, but not the order of events, not the decision points, not what happens when the payment is declined. Structure is a what exists view. The question is a what happens view. Pointing at boxes and narrating arrows is us papering over a missing diagram.
The behavior notations we already have
The industry has several good answers, each with a home ground:
Sequence diagrams (UML) show participants exchanging messages over time, top to bottom. Precise about ordering and synchronous/asynchronous calls; best for a single interaction in detail.
BPMN (Business Process Model and Notation) is a standard for business processes: events, tasks, gateways, pools and lanes. Rich and executable; at home where processes are the product.
Swimlane diagrams (cross-functional flowcharts) put each actor or system in a lane and route the flow of steps across lanes. The least formal of the three — and the one most people can read with zero training.
All three work. But in practice they share one weakness, and it is not in the notation.
The weakness: lanes are just text
In most tools, the participant in a sequence diagram and the lane in a swimlane diagram is a text label. You type "Order API". Meanwhile your architecture diagram has a box also labelled "Order API" — and nothing connects them.
Consequences accumulate quietly:
- The API gets renamed or split; every behavior diagram naming it is now wrong, and nothing tells you.
- You cannot ask "which flows touch this container?" — the information exists only in people's memory of the diagrams.
- Structure diagrams and behavior diagrams drift apart until they describe two different systems.
The fix is conceptually simple: the lane should be the architecture element, not share its name by coincidence.
What binding looks like
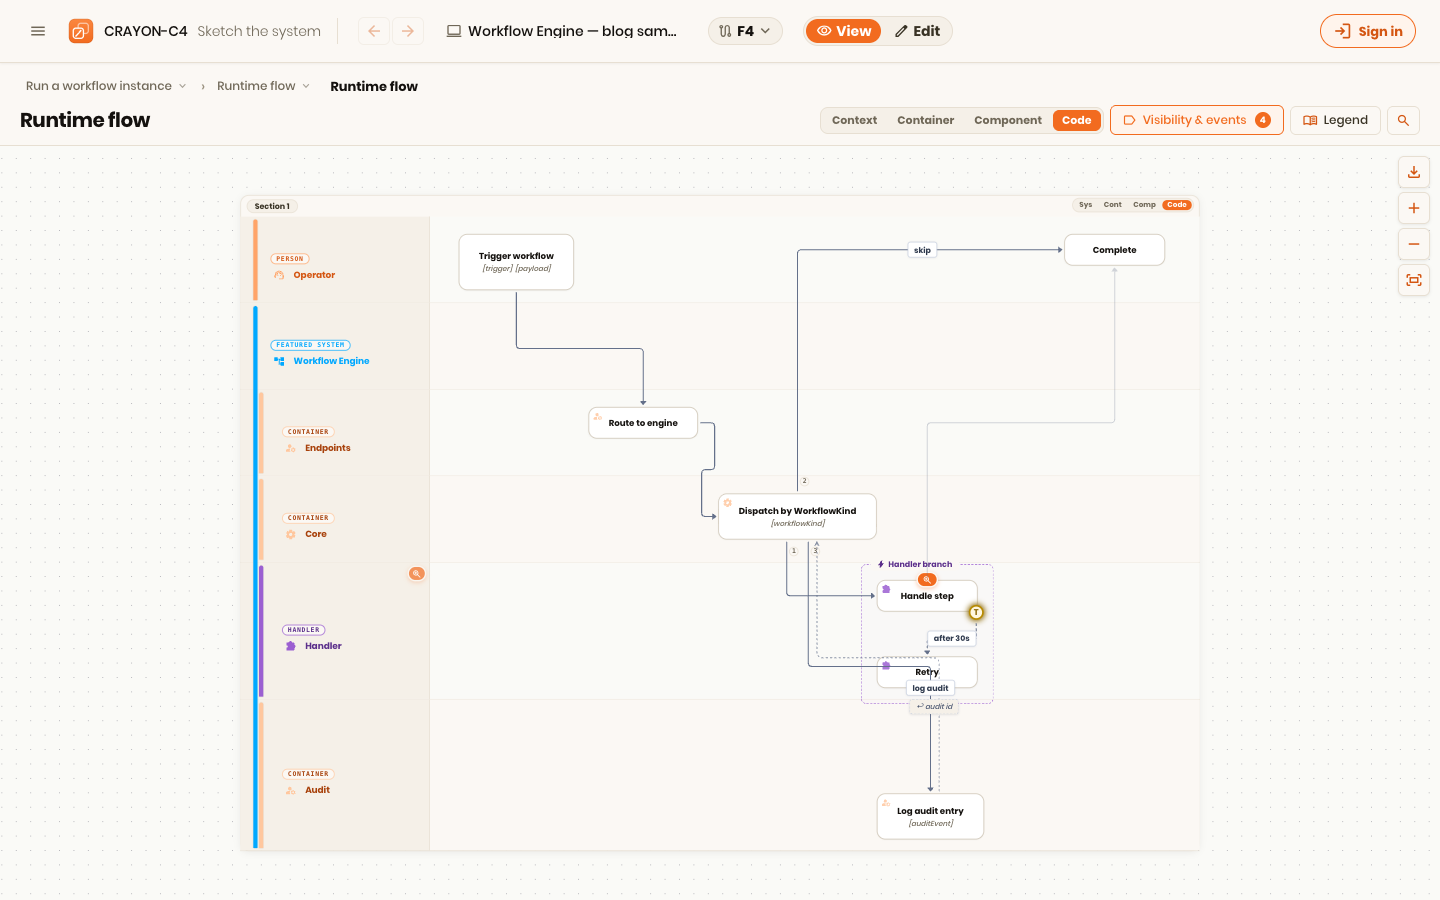
In CRAYON-C4 the behavior notation is called F4 — flat swimlane diagrams, one per process. The part relevant to this post:
- A lane can be bound to a C4 element — a system, a container, a component. The lane's identity comes from the model. Rename the container, the lane follows.
- Because lanes know their C4 element, they know their C4 level — so lanes nest the way the architecture nests, and you can collapse a flow to a higher level: view the same process at component detail, or zoomed out to containers, or to whole systems for a stakeholder version. One diagram, several altitudes — nothing redrawn.
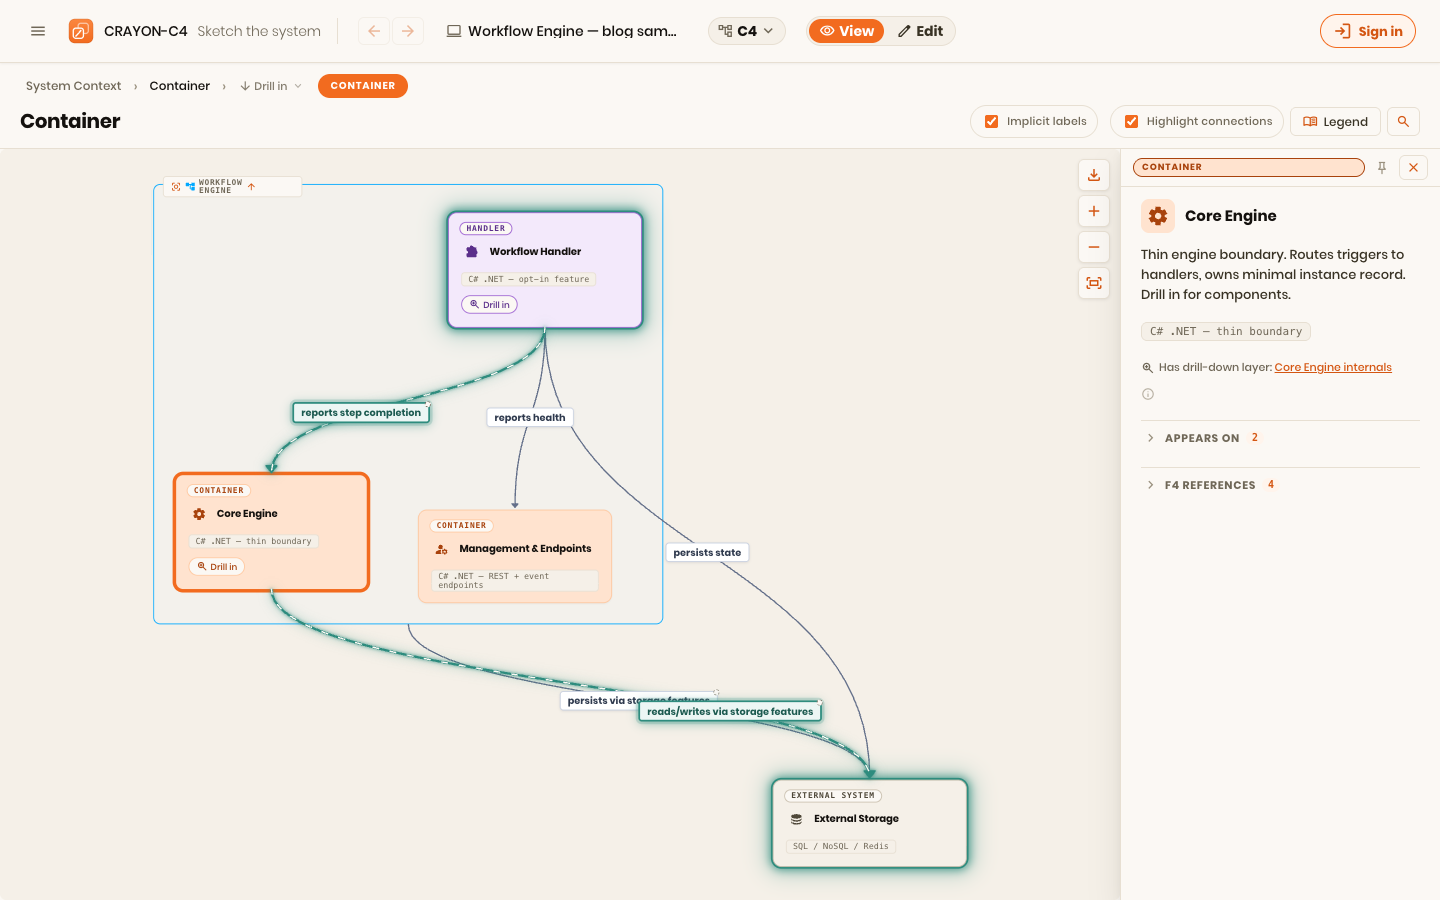
- Traceability runs both ways: select a container in the architecture view and see every flow that touches it, before you refactor it.
Here is the runtime flow from the demo project — a dispatch running across the engine's containers, lanes bound to the C4 elements that perform each step:
And here is traceability the other way: selecting the Core Engine container in the C4 viewer shows every diagram it appears on and every F4 flow that touches it, right in the side panel.
The demo project ships with worked flows for a workflow engine — how a definition gets published, how a dispatch runs across the engine's containers. Open it and switch between the F4 view and the C4 view; select a lane and follow it back into the architecture:
Habits that keep behavior diagrams alive
Whatever notation and tool you use:
- One diagram per process. "Everything" flows die the same death as One Big Diagrams.
- Verb-first step names. "Reserve stock", "Decline payment" — a flow should read as a sentence chain.
- Draw the unhappy path. The happy path is rarely where the questions are. Payment declined, stock missing, timeout — that is the knowledge worth writing down.
- Bind participants to the architecture if your tooling allows it. If it doesn't, at least enforce that names match the architecture diagram — by review if necessary.
Next in this series: the third view — where does all of this actually run? Deployment diagrams, environment drift, and keeping "what runs where" out of people's heads.